> ## Documentation Index
> Fetch the complete documentation index at: https://docs.niro.cx/llms.txt
> Use this file to discover all available pages before exploring further.
# Monitor Your Fleet
> Use Niro's fleet overview, pod inventory, and timeline to understand what's happening across all your clusters.
## Fleet overview
The **Fleet** page (`/clusters`) is your main dashboard. It shows all clusters in your organization with live status:
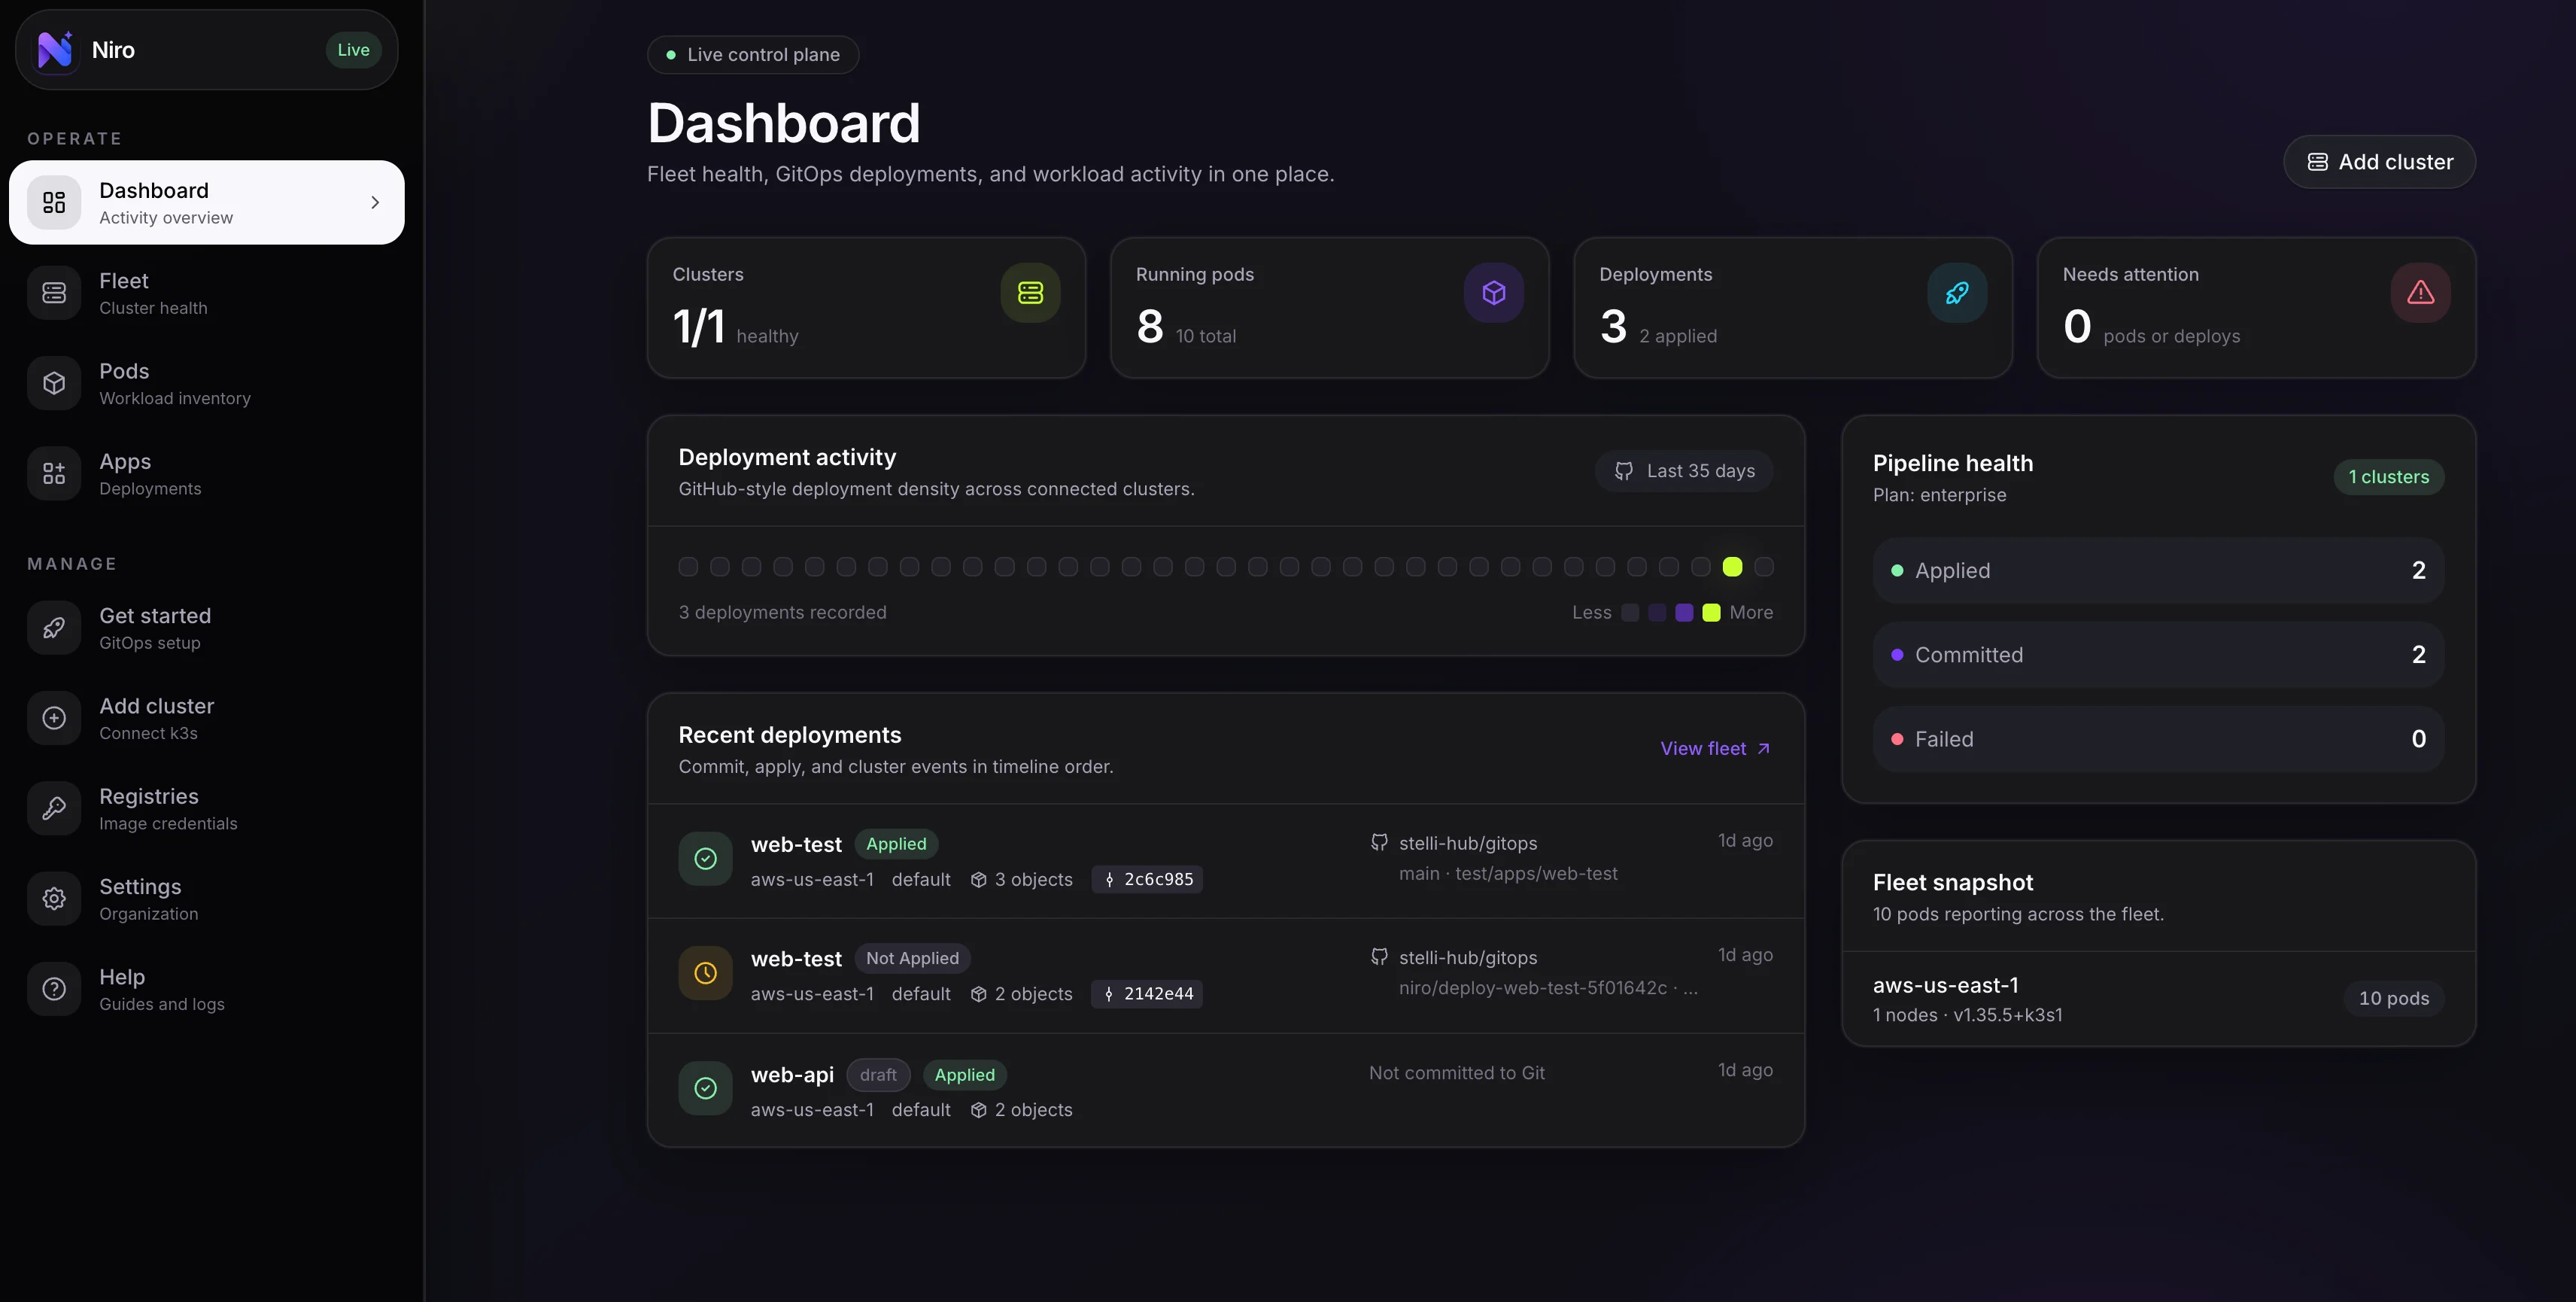 Status rolls up from cluster heartbeats, node readiness, and active incidents.
See pods, owners, restarts, images, events, and resource pressure together.
Alerts, policy findings, and timeline events keep failures explainable.
The agent sends state over outbound HTTPS from private clusters.
| Column | Description |
| ------------------ | --------------------------------------------------------------- |
| **Name** | Cluster name and environment badge |
| **Status** | Healthy / Warning / Critical / Unknown / Offline |
| **Nodes** | Number of nodes in the cluster |
| **Pods** | Total pod count across all namespaces |
| **CPU / Memory** | Aggregate usage across all nodes (requires `metrics-server`) |
| **Last heartbeat** | Time since the last heartbeat was received (refreshes every 5s) |
Click any cluster to open its detail view.
### Status rollup
The status badge is derived from active incidents:
* **Healthy** — no active incidents
* **Warning** — at least one low or medium severity incident is firing
* **Critical** — at least one high severity incident is firing
* **Unknown** — the cluster has never sent a heartbeat (recently enrolled but agent not yet running)
* **Offline** — the last heartbeat was too long ago — a `cluster_offline` incident has fired
## Cluster detail view
The cluster detail view gives you a deep look at a single cluster.
### Nodes tab
Shows all nodes with:
* **Status** — Ready or not-ready conditions
* **Roles** — control-plane, worker, etc.
* **Kubernetes version**
* **CPU** — requested / allocatable / used (if metrics-server is installed)
* **Memory** — requested / allocatable / used
A node shown as **Not Ready** will also appear as an incident in [Alerts](/features/alerts).
### Workloads tab
A namespace-by-namespace breakdown of pods:
* Pod count per namespace
* Phase breakdown (Running, Pending, Failed, Succeeded)
* Click a namespace to filter the pod list
### Deployments tab
All Niro-managed deployments on this cluster:
* **Name** — deployment name with a link to the detail page
* **Namespace**
* **Status** — last apply status (Succeeded / Partial / Failed)
* **Last applied** — time of last successful apply
* **Sync** — whether auto-sync with Git is enabled
### Timeline tab
The cluster's activity feed showing:
* Agent restarts and version changes
* Kubernetes Warning events (from the cluster's event stream)
* Deployment apply events (created, succeeded, failed)
* Policy finding changes
* Drift detection events
The timeline is a mix of events stored directly (restarts, k8s events) and events derived at read-time (lifecycle, drift, apply commands). It gives you a complete picture of what happened and when.
## Pod inventory
The **Pods** page (`/pods`) shows a cross-cluster inventory of all pods across your fleet.
### Columns
| Column | Description |
| ------------ | ----------------------------------------------------------------- |
| **Pod** | Pod name + namespace + cluster |
| **Phase** | Running, Pending, Failed, Succeeded, Unknown |
| **Restarts** | Total restart count across all containers in the pod |
| **Owner** | The Deployment, StatefulSet, DaemonSet, or Job that owns this pod |
| **Image** | Container image(s) in the pod |
| **CPU** | Usage / requests / limits (if metrics-server is installed) |
| **Memory** | Usage / requests / limits |
| **Ready** | N/M containers ready |
### Filtering
Filter by:
* **Cluster** — show only pods from specific clusters
* **Namespace** — filter by namespace name
* **Phase** — show only Failed or Pending pods to find problems quickly
* **Search** — filter by pod name, image, or namespace
### Finding problem pods
Sort by **Restarts** (descending) to quickly find crash-looping pods. Sort by **Phase** to find pods stuck in Pending or Failed state.
Click any pod to see its details: full container list, environment, volumes, events, and (if the log capability is enabled) the **View logs** button.
## Metrics
Node and pod CPU/memory metrics require [metrics-server](https://github.com/kubernetes-sigs/metrics-server) to be installed in your cluster. If metrics-server is not installed, usage columns show `—`.
To install metrics-server in k3s:
```bash theme={"theme":{"light":"github-light","dark":"vesper"}}
kubectl apply -f https://github.com/kubernetes-sigs/metrics-server/releases/latest/download/components.yaml
```
k3s ships with a lightweight metrics-server included. If you're on a standard k3s installation, metrics should be available automatically. If they're not showing up, check `kubectl top nodes` to verify metrics-server is working.
## Activity timeline (org-wide)
The **Timeline** in the sidebar (or on the Settings page) shows an org-wide activity feed across all clusters. This is useful for MSPs or teams managing multiple clusters who want a single stream of all activity.
## Alerts and incident detection
Niro monitors your fleet for incidents automatically and can notify you via Slack, Discord, PagerDuty, or webhook. See [Alerts & Incidents](/features/alerts) for details.
## Related
* [Alerts & Incidents](/features/alerts) — incident detection and notification channels
* [Stream Pod Logs](/guides/pod-logs) — live log streaming from pods
* [AI Incident Investigator](/features/ai-investigation) — AI-powered root cause analysis
* [Resource Inventory](/features/resources) — browse all Kubernetes resources across the fleet
* [Cost Monitoring](/features/cost) — cluster and workload cost breakdown
* [Clusters](/concepts/clusters) — cluster concepts and status
Status rolls up from cluster heartbeats, node readiness, and active incidents.
See pods, owners, restarts, images, events, and resource pressure together.
Alerts, policy findings, and timeline events keep failures explainable.
The agent sends state over outbound HTTPS from private clusters.
| Column | Description |
| ------------------ | --------------------------------------------------------------- |
| **Name** | Cluster name and environment badge |
| **Status** | Healthy / Warning / Critical / Unknown / Offline |
| **Nodes** | Number of nodes in the cluster |
| **Pods** | Total pod count across all namespaces |
| **CPU / Memory** | Aggregate usage across all nodes (requires `metrics-server`) |
| **Last heartbeat** | Time since the last heartbeat was received (refreshes every 5s) |
Click any cluster to open its detail view.
### Status rollup
The status badge is derived from active incidents:
* **Healthy** — no active incidents
* **Warning** — at least one low or medium severity incident is firing
* **Critical** — at least one high severity incident is firing
* **Unknown** — the cluster has never sent a heartbeat (recently enrolled but agent not yet running)
* **Offline** — the last heartbeat was too long ago — a `cluster_offline` incident has fired
## Cluster detail view
The cluster detail view gives you a deep look at a single cluster.
### Nodes tab
Shows all nodes with:
* **Status** — Ready or not-ready conditions
* **Roles** — control-plane, worker, etc.
* **Kubernetes version**
* **CPU** — requested / allocatable / used (if metrics-server is installed)
* **Memory** — requested / allocatable / used
A node shown as **Not Ready** will also appear as an incident in [Alerts](/features/alerts).
### Workloads tab
A namespace-by-namespace breakdown of pods:
* Pod count per namespace
* Phase breakdown (Running, Pending, Failed, Succeeded)
* Click a namespace to filter the pod list
### Deployments tab
All Niro-managed deployments on this cluster:
* **Name** — deployment name with a link to the detail page
* **Namespace**
* **Status** — last apply status (Succeeded / Partial / Failed)
* **Last applied** — time of last successful apply
* **Sync** — whether auto-sync with Git is enabled
### Timeline tab
The cluster's activity feed showing:
* Agent restarts and version changes
* Kubernetes Warning events (from the cluster's event stream)
* Deployment apply events (created, succeeded, failed)
* Policy finding changes
* Drift detection events
The timeline is a mix of events stored directly (restarts, k8s events) and events derived at read-time (lifecycle, drift, apply commands). It gives you a complete picture of what happened and when.
## Pod inventory
The **Pods** page (`/pods`) shows a cross-cluster inventory of all pods across your fleet.
### Columns
| Column | Description |
| ------------ | ----------------------------------------------------------------- |
| **Pod** | Pod name + namespace + cluster |
| **Phase** | Running, Pending, Failed, Succeeded, Unknown |
| **Restarts** | Total restart count across all containers in the pod |
| **Owner** | The Deployment, StatefulSet, DaemonSet, or Job that owns this pod |
| **Image** | Container image(s) in the pod |
| **CPU** | Usage / requests / limits (if metrics-server is installed) |
| **Memory** | Usage / requests / limits |
| **Ready** | N/M containers ready |
### Filtering
Filter by:
* **Cluster** — show only pods from specific clusters
* **Namespace** — filter by namespace name
* **Phase** — show only Failed or Pending pods to find problems quickly
* **Search** — filter by pod name, image, or namespace
### Finding problem pods
Sort by **Restarts** (descending) to quickly find crash-looping pods. Sort by **Phase** to find pods stuck in Pending or Failed state.
Click any pod to see its details: full container list, environment, volumes, events, and (if the log capability is enabled) the **View logs** button.
## Metrics
Node and pod CPU/memory metrics require [metrics-server](https://github.com/kubernetes-sigs/metrics-server) to be installed in your cluster. If metrics-server is not installed, usage columns show `—`.
To install metrics-server in k3s:
```bash theme={"theme":{"light":"github-light","dark":"vesper"}}
kubectl apply -f https://github.com/kubernetes-sigs/metrics-server/releases/latest/download/components.yaml
```
k3s ships with a lightweight metrics-server included. If you're on a standard k3s installation, metrics should be available automatically. If they're not showing up, check `kubectl top nodes` to verify metrics-server is working.
## Activity timeline (org-wide)
The **Timeline** in the sidebar (or on the Settings page) shows an org-wide activity feed across all clusters. This is useful for MSPs or teams managing multiple clusters who want a single stream of all activity.
## Alerts and incident detection
Niro monitors your fleet for incidents automatically and can notify you via Slack, Discord, PagerDuty, or webhook. See [Alerts & Incidents](/features/alerts) for details.
## Related
* [Alerts & Incidents](/features/alerts) — incident detection and notification channels
* [Stream Pod Logs](/guides/pod-logs) — live log streaming from pods
* [AI Incident Investigator](/features/ai-investigation) — AI-powered root cause analysis
* [Resource Inventory](/features/resources) — browse all Kubernetes resources across the fleet
* [Cost Monitoring](/features/cost) — cluster and workload cost breakdown
* [Clusters](/concepts/clusters) — cluster concepts and status